Objectives
The goal of this lab is to provide a gentle introduction to Processing, the environment we will use for this class. It will also help you get used to drawing to the screen, loading data from a file, and thinking about how to represent data.
What is Processing?
Processing is actually several things:
- A website.
- A programming environment focused on learning computation design.
- A sketchbook for rapid prototyping.
- A 2D or 3D graphics API & rendering engine for Java.
- An open project created by Casey Reas and Ben Fry.
It is especially useful in this course because it is straight-forward to learn and is well-suited to graphics applications. Processing has several language modes, including Java and Python. We’re going to use the Java mode, but there is also a Python version of this lab available. Processing provides a basic set of drawing operations that simplifies the task of setting up a drawing canvas and drawing on it.
It is great for generating and modifying images, and includes support for:
- vector & raster drawing,
- image processing,
- color models,
- mouse and keyboard events,
- network communication,
- object-oriented programming,
- and lots more.
In short, it has what we need to be able to create complex applications, while letting us focus on the representation and interaction in our visualizations.
Examples
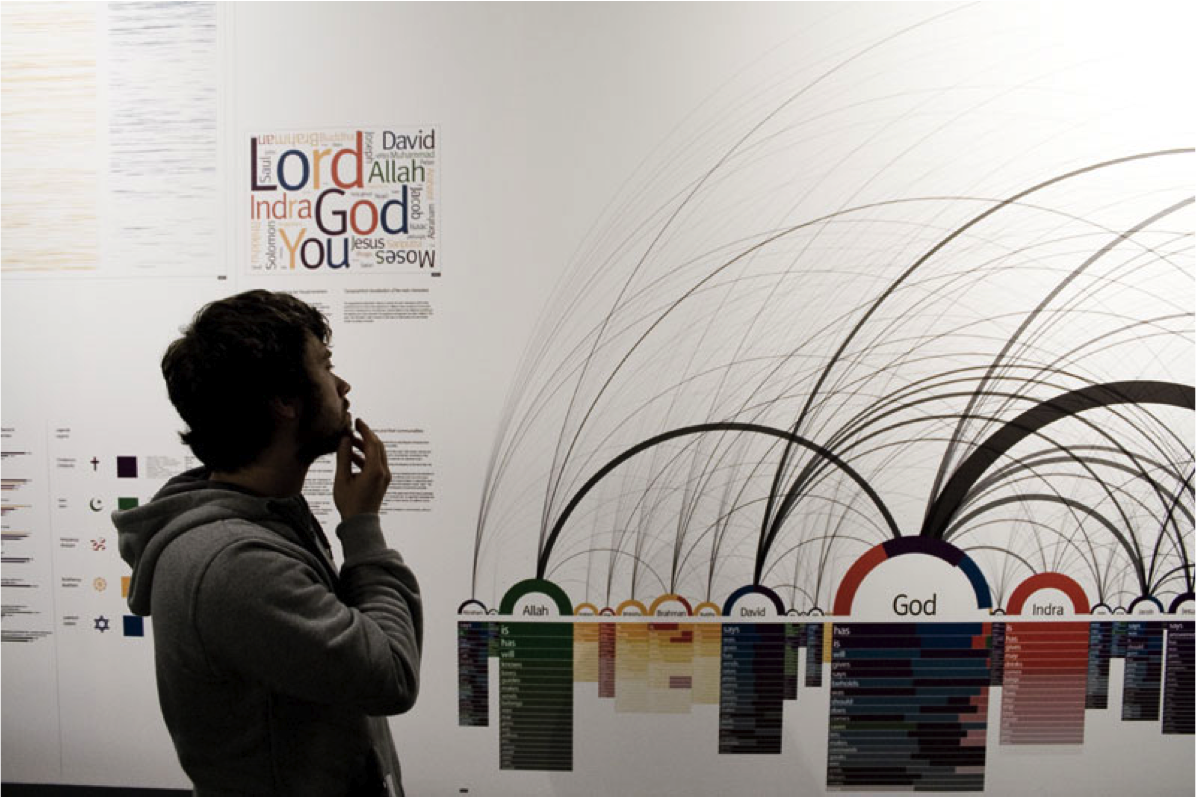 Similar Diversity
by Philipp Steinweber & Andreas Koller
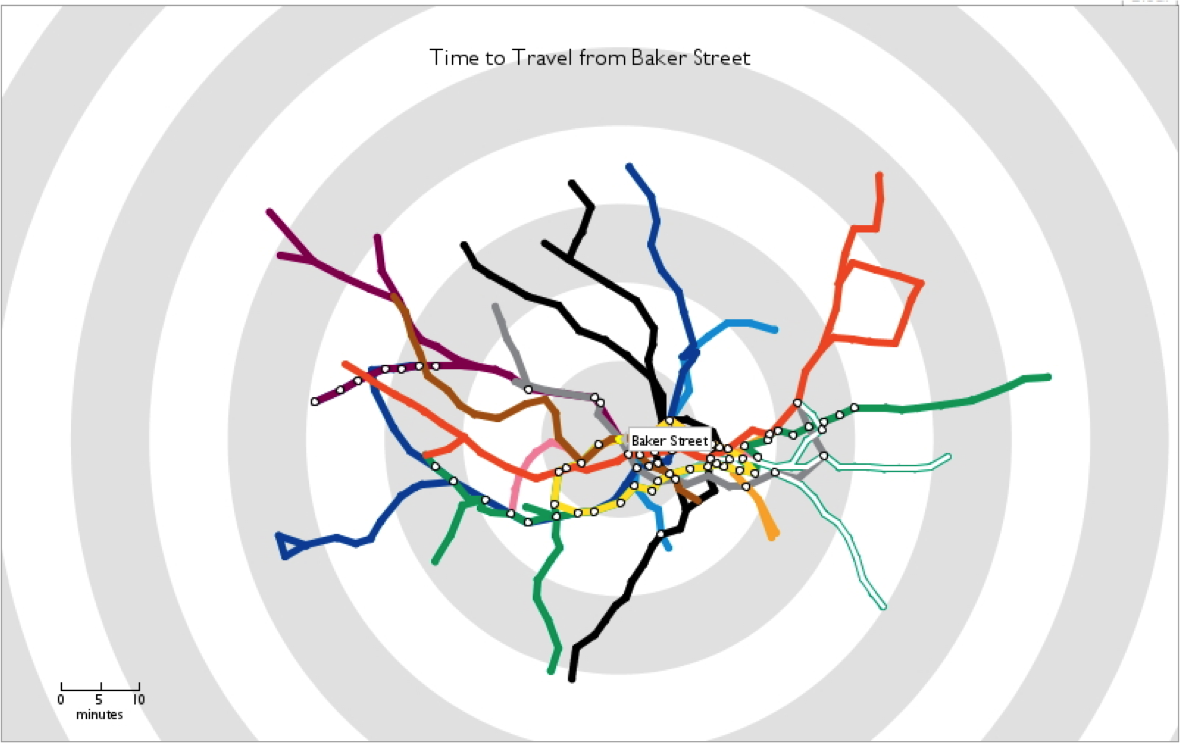 Travel Time Tube Map
by Tom Carden
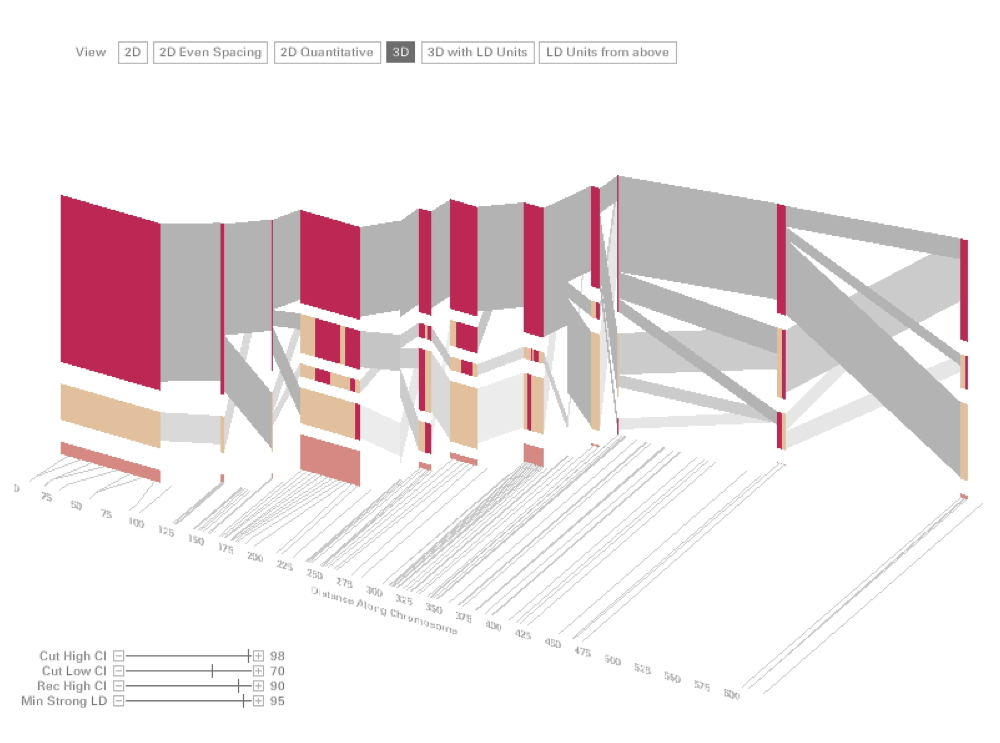 Visualizing Haplotype
by Ben Fry (Cover of Nature)
Getting started
Processing includes its own development environment, shown below:
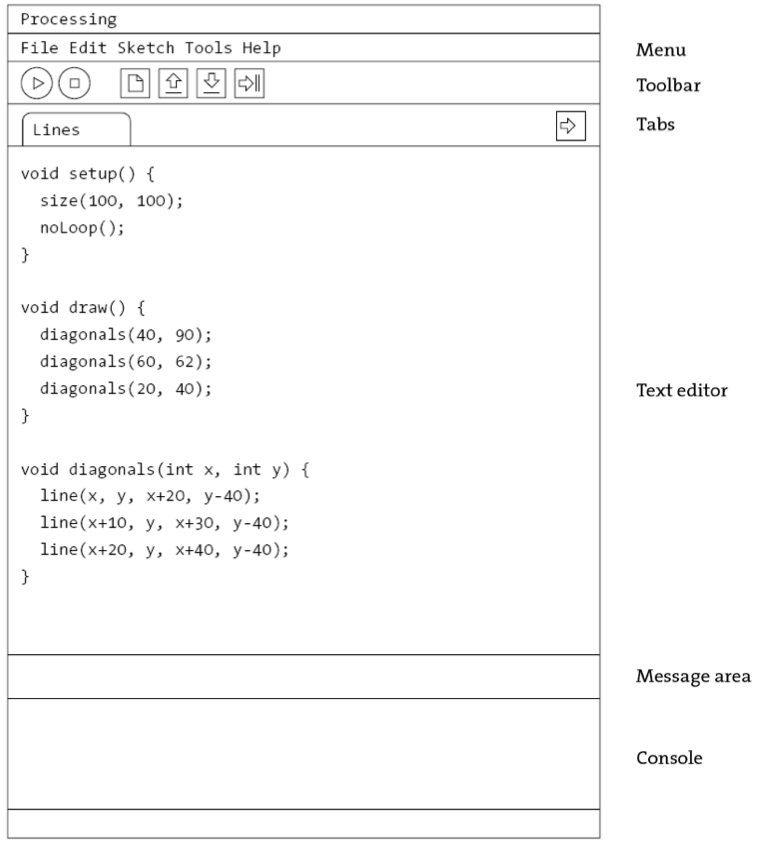
The Processing development environment refers to projects as sketches (which is related to its origins as a “sketchbook” for rapid prototyping). A Sketch can be made up of several files, which can be .pde (processing development environment) or .py files.
Assignment 1
In our first assignment, we are going to learn how to use Processing to draw the following image:
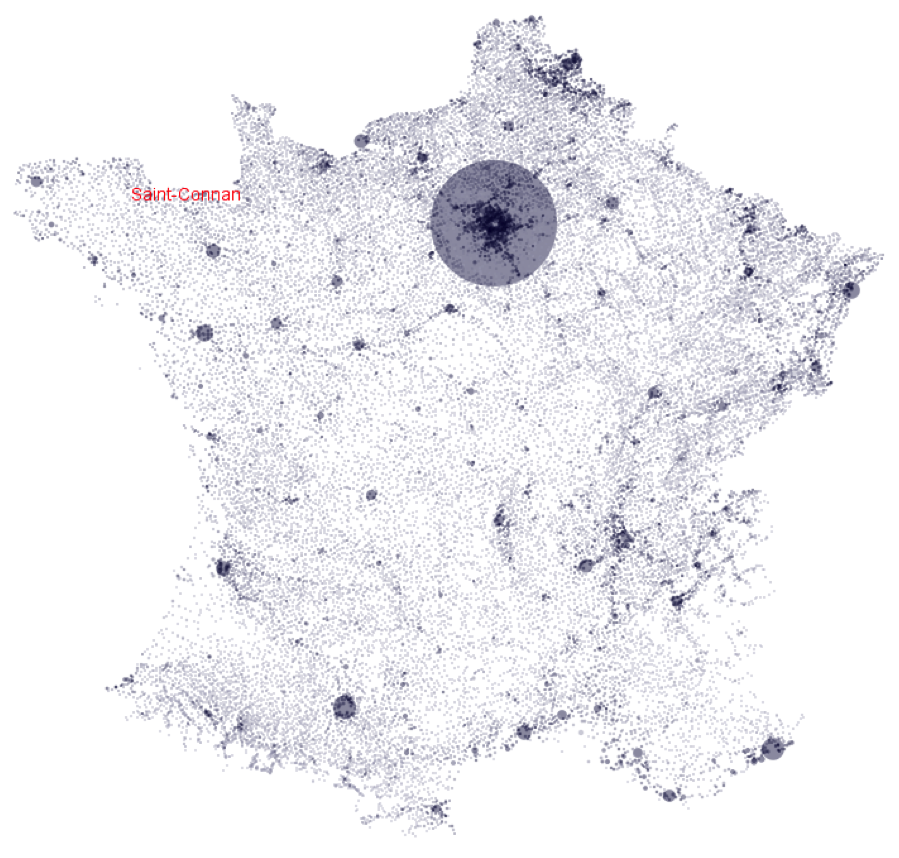
In order to do so, you will need to:
- Load and parse the data.
- Choose an internal data structure to represent these data.
- Draw them to the screen.
The data we will use comes from www.galichon.com/codesgeo. The original data was in the form:
- (name, postal code, insee code, longitude, latitude)
- (name, insee code, population, density)
To simplify things, we will instead use a pre-processed version of these data courtesy of Petra Isenberg, Jean-Daniel Fekete, Pierre Dragicevic and Frédéric Vernier. It merges these into:
- (postal code, x, y, insee code, place, population, density)
Getting started
First, open up Processing. In the lab, you can use the command-line by opening a Terminal window and typing:
~eagan/Public/processing
If you are using your own computer, you can download Processing.
On the top, right corner of the window, you should see a pull-down menu with the word Java in it. Processing is currently in Java mode. If this menu shows a different language than Java, switch it to Java mode. You should see Processing restart automatically.
Let’s create a blank canvas. In this lab, I’ll start off by showing you the code to write. As we progress, I’ll show you less and less, and leave more open to your own interpretation. Please resist the temptation to just copy and paste the code. It’s important to understand what’s going on. Even if it seems obvious, writing (or typing) the code out by hand helps to reinforce things in your mind, so please type the following code in the window:
:::java
void setup() {
    size(800, 800);
    noLoop();
}

void draw() {
    background(255);
}
The setup() and draw() methods are built-in methods in Processing that are called automatically when your program starts and each time the window repaints, respectively.
Try pressing the Run button. You should see an 800 by 800-pixel-wide window with a white (255) background.
Loading data
Now lets take a look at the data we’re going to use. Open them in your preferred text editor. Notice that this a file containing a data table in a tab-separated format. Let’s go ahead and read that file:
:::Java
void readData() {
    String[] lines = loadStrings("http://www.infres.enst.fr/~eagan/class/as2014/inf229/data/population.tsv");
    println("Loaded " + lines.length + " lines."); // for debugging
}
Now call readData() from setup(). When you run the program, you should see this data file displayed on the console.
Parsing the data
Now let’s parse the data so we can actually make use of it. For now, we’re going to break good coding practice and define a few global variables to store the coordinates of all of the places in our data file. At the top of the file, add the following lines:
:::java
float x[];
float y[];
float minX, maxX;
float minY, maxY;
We’ll store the coordinates of all of the places in the data file in the x and y arrays. We’ll come back to the minX, maxX and Y later. Add the following lines at the end of our readData() method:
:::java
// First line contains metadata
// Second line contains column labels
// Third line and onward contains data cases
for (int i = 2; i < lines.length; ++i) {
    String[] columns = lines[i].split("\t"); // split into columns separated by a tab
    x[i-2] = float(columns[1]);
    y[i-2] = float(columns[2]);
}

minX = min(x);
maxX = max(x);
minY = min(y);
maxY = max(y);
Try running the program. You won’t see anything new, but it should at least run without errors. It’s usually a good idea to frequently run your program while you’re developing it to make sure you haven’t introduced any new bugs, even if you won’t necessarily see anything new.
Drawing
Now let’s get to the fun part. We’ve extracted the points from the data file and stored them in our x/y arrays. Let’s see what this looks like. Update the draw() method to add:
:::java
background(255);
black = color(0);
for (int i = 0; i < x.length; ++i) {
    set((int)x[i], (int)y[i], black); // Why won't this work?
}
What do you expect to happen when you run the program? Try it out. Run the program. What actually happens? Can you think of a reason why we don’t see anything on the screen?
Still not sure? Let’s take a closer look at our data. Recall that each row is in the following format:
(postal code, x, y, insee code, place, population, density)
We only use the x and y columns. Think about it before continuing on.
map()
The x and y columns in the data set are expressed in longitude and latitude, not in terms of pixel coordinates on the screen. All of our coordinates correspond to a single pixel, which happens to be drawn off-screen since all of France has a negative longitude.
We need to create a mapping from longitude, latitude to x, y-coordinates on the screen. Assuming a flat projection, the math is actually pretty simple, and processing has a builtin function to do this for us:
map(value, domainMin, domainMax, rangeMin, rangeMax);
This function will take a value in a given domain and normalize it to the given range. We already know the domain of our values; we calculated it earlier and stored it in minX, maxX, etc. Let’s modify our drawing loop to use them as follows:
:::java
for (int i = 0; i < x.length; ++i) {
    int x = int(map(x[i], minX, maxX, 0, width));
    int y = int(map(y[i], minY, maxY, 0, height));

    set(x, y, black);
}
The variables width and height are builtin to Processing and correspondent to the dimensions of our window (what we gave to size() in our setup() function).
Let’s try running the program one more time, and this time we should be able to marvel in the wonder of your beautiful drawing. Or fix any bugs and then marvel.
Graphics coordinates
Have you noticed something peculiar about our map of France?
In most graphics environments, the origin (0, 0) is located at the top, left of the canvas. Latitudes, on the other hand, start at the equator, which we tend to think of as being to the bottom of France. No worries, all we need to do is invert either our domain or our range in the above mapping function.
Make that change and re-run the program. Is Corsica at the top or the bottom? Do we indeed see the Finistère next to the Channel, or is it hanging out in the Mediterranean?
Places
Let’s create a class Place. Create a new tab (using the right-arrow icon on the right side of the window) for our class:
:::java
class Place {
    static float minX, maxX;
    static float minY, maxY;

    float longitude;
    float latitude;
    String name;
    int postalCode;
    float population;
    float density;
}
We’ll then need to modify the loop in our readData() method to use this new class:
:::java
float x[];
float y[];

for (int i = 2; i < lines.length; ++i) {
    String columns[] = lines[i].split("\t");
    Place place = new Place();
    place.postalCode = (int)columns[0];
    place.longitude = (float)columns[1];
    place.latitude = (float)columns[2];
    x.add(place.longitude);
    y.add(place.latitude);
    place.name = columns[4];
    place.population = (int)columns[5];
    place.density = (float)columns[6];

    places.add(place)

Place.minX = min(x);
Place.maxX = max(x);
Place.minY = min(y);
Place.maxY = max(y);
Let’s also clean up our drawing. Add a new method draw() to your Place class and move the code from your main draw() function there. In the main draw function, just put:
:::java
for (Place place : places) {
    place.draw();
}
Try running the program. If it doesn’t run, try fixing any errors we might have introduced until it works.
Properties
It turns out that converting between longitude, latitude and pixel coordinates is something we’ll be doing a lot of in our program. Let’s refactor that out into its own method. “Refactor” is just a fancy word for re-organizing the code we’ve written. Add the following to our Place class (anywhere is fine, but I like to this kind of thing just after the attributes and before the other methods):
:::java
int x() {
    return (int)map(longitude, minX, maxX, 0, width);
}

int y() {
    return (int)map(latitude, minX, maxX, 0, width);
}
Now, in our draw() method, we can remove the two map() calls and use x() and y() in the set() function call:
:::java
void draw(self) {
    black = color(0);
    set(x(), y(), black);
}
On your own…
That’s great for getting started, but what we’ve created so far is really only little more than an info vis “Hello, world” (or, more properly, “Hello, France!”).
To better understand our toolbox, let’s look at the Processing Reference, which you can access via the menu Help > Reference. These are the builtin methods and functions of Processing. Take particular note of:
size()point(), line(), triangle(), quad(), rect(), ellipse(),andbezier()background(), fill(), stroke(), noFill(), noStroke(), strokeWeight(), strokeCap(), strokeJoin(), smooth(), noSmooth(), ellipseMode(),andrectMode().
You should now have the tools you need to update your visualization to:
- Show population and density
You’re also going to make your visualisation interactive. When the user clicks on a place, draw its name and postal code. You will need the following tools to do so:
Text rendering
Processing uses bitmap fonts to draw text. These are different than the system fonts installed. To create one, go to the Tools > Create Font... menu. This panel will let you generate a bitmap font you can use in your program. Copy the filename that is created at the bottom of the screen. Then double-check that the font file is in the data folder of your project using the Sketch > Show Sketch Folder menu.
To use the font, first create a global variable PFont labelFont to store the font. Then modify your setup() method to load and configure the font:
:::java
void setup() {
    // ...
    labelFont = loadFont("font filename from above.vlw");
    textFont(labelFont, 32); // From now on, all drawing will use the labelFont at 32 point.
}
Then modify your drawing method to draw some text using text("Hello, France!", x, y) where x and y are the coordinates at which to draw the text. Hint: you may find the fill() function useful.
User events
When the user performs certain actions, such as moving the mouse, pressing or releasing the mouse button, etc, Processing will call certain methods:
mousePressed()mouseDragged()mouseReleased()mouseMoved()
You can also access the mouse position with mouseX and mouseY, and you can test which button is pressed with:
:::java
if (mousePressed == true) { /* ... */ }
if (mouseButton == left) { /* ... */ }
 Assignment based on one by Petra Isenberg, Jean-Daniel Fekete, Pierre Dragicevic and Frédéric Vernier under a Creative Commons Attribution-ShareAlike 3.0 License.