Objectives
In the previous lab assignment, we created a map of France that looked something like this:
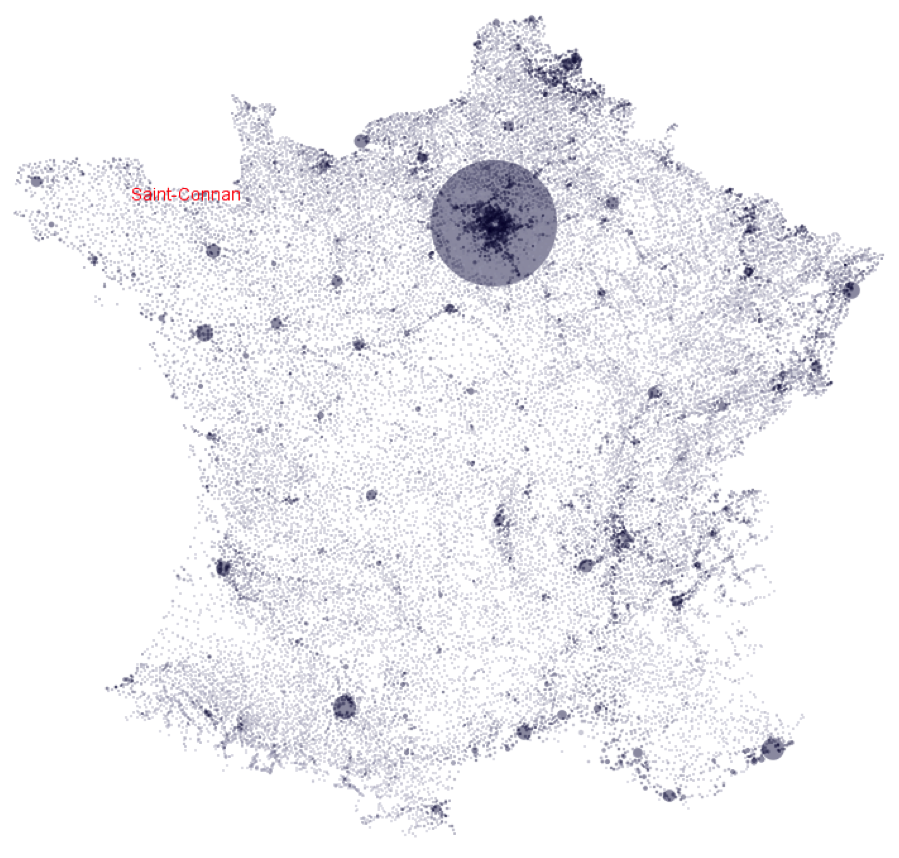
To do so, we saw how to:
- Parse a data file and store it in an array
- Re-map data items from one coordinate system to another
- Draw different kinds of shapes, colors, and text to the screen
Today, we are going to extend the solution from the previous lab to add interaction. Be sure to test your application often, at minimum after each of the steps below.
Step 1: Filtering out small cities
Right now, we show all the data. For any large dataset, that might overwhelm the presentation to the user or be too slow to calculate. Let’s filter out the smaller cities.
- In your main program, add a new global variable
minPopulationToDisplayand set it to some value, say 10000. - Modify your drawing code such that it skips any cities below that threshold.
- Use the
text()function to display “Displaying populations above x” in the app window, where x is the population threshold you’ve chosen.
Step 2: Making the filtering interactive
Now, let’s give the user the ability to change the filtering threshold using the keyboard.
- Create a
keyPressed()function in your main program file. - Read the variables
keyorkeycodeto figure out which key has been pressed and update the population cutoff accordingly.- Hint: you probably want to change this threshold by multiplying or dividing it by a constant rather than incrementing or decrementing it.
- Make sure you call
redraw()at the end of the function so that Processing knows it needs to do so.
Step 3: Using the mouse
So far, the user has to have a pretty good knowledge of France and its geography to make sense of the map. Let’s add the ability to hover on top of a city with the mouse to show its name.
Getting mouse events
As a first step, let’s just make sure we can use the mouse. When the user moves the mouse, the system will notify your program using the mouseMoved() function. Let’s just display these coordinates to the console for now.
- Add a
mouseMoved()function to your main program file. - Use
println()to show the mouse coordinatesmouseXandmouseYto the console.
Implementing geometric picking
So far, so good. Let’s now associate these mouse coordinates with the places in our dataset. To do so, we’ll need to do something called picking: mapping the position of the cursor to the appropriate associate object (in our case, a Place).
- Add a method
contains(x, y)to thePlaceclass. This method should return true iff the x, y position (expressed in window coordinates) is contained within the displayed shape. Because this method links the user’s interactions to the data, it needs to be consistent with thePlace’s drawing method. For example, if the place is drawn with a radius, r, then thecontains()method should accept a tolerance of r (or better, r + 1 to give the user an extra pixel to hit). - In your main program file, add a method
pick(x, y)that returns thePlacebelow the given point. If there are multiple places, this should give the one that is drawn on top. If there is no place at that point, return anull/Nonevalue.- Hint: loop over the cities in the reverse order of how they were drawn to get the place that was drawn last.
- Modify the
mouseMoved()function to show the name of the city (if any) below the mouse cursor to the console. - Test the program, then modify the code such that the name of the current city is shown only once it changes. To do this, you can create a global variable to store the last picked place.
Step 5: Adding glossing
Now let’s make it so that the city under the cursor is highlighted.
- Add a boolean variable
highlightedto yourPlaceclass. - Modify the drawing method so that the color of the place is different when highlighted.
- Hint: We saw in class that we shouldn’t use color to encode too many things at once. Is it really a good idea to use color to convey highlighting here? If you already use color as a visual variable, you should try a different highlighting effect (e.g., displaying an additional circle, changing the alpha (transparency) value of the color or using darker colors. See here about transparency and here on mixing colors).
- In the
mouseMoved()function in the main program, update the highlighted status of the place under the mouse, then call theredraw()method. - Test the program. There is one thing that we forgot to do. Can you spot it?
Step 6: Revealing city names
So far, we only show the name of the city on the Processing console. Let’s show that in the visualization.
- Modify your
Place’s drawing method such that the name of the city is displayed next to it whenever it is highlighted.- Hint: you will probably have to fiddle with things to get the alignment just right.
- Hint 2: You can use the
textAlign()function to adjust the vertical alignment.
- Display a translucent rectangle below the text to make it easier to read.
- Hint: use the
textWidth()method to calculate the width of a text string.
- Hint: use the
Next steps (optional)
- Add a
selectedboolean flag to thePlaceclass. Whereas places are highlighted and unhighlighted as the mouse moves, a selection is toggled with a click. - Add a widget to the top of the window that shows the population range like an inverted progress bar.
- Hint: use a log scale or a power scale.
- Make this widget respond to mouse drags
For the ambitious…
- Turn the population widget above into a range slider.
- Show the distribution of cities inside the range slider, using either a histogram or a color map. (We will see these in a later class.)
- Use excentric labelling to show the labels of overlapping cities.
- Add support for panning and zooming.
Turning in your code
Your project is due at “midnight,” January 9.
- Add a comment to the top of your main program file with your full name.
- Create a README file (in plain text, PDF, or html) with instructions on how to use your program, the possible interactions, and how you chose to represent the data.
- Add your README file to the project with
Sketch > Add File.... This will put that file in your project’sdatafolder. - Use the
File > Save As...command to save a copy of your project (called a Sketch in Processing) with your last name and first initial as its name. For example, mine would be namedeaganj. - Use the
Tools > Archive Sketchmenu to create a .zip of your project. - Turn in your code to the labs 1 & 2 submission site.
Grading
The goal of this assignment is to explore how to create a visualization from data. It is intended primarily as a primer for you to learn about the Processing environment that you may use in your Projects. Generally speaking, this class is about a creating a good visualization, not about programming. A good visualization with a messy implementation is better than a poor visualization with a good implementation. (A good visualization with a good implementation is even better.)
With all that in mind, this assignment will be graded on a √+ / √ / √- scale, and counts as one of the short homeworks.
Late submissions
Any submission turned in after the due date will receive the next lower grade if turned in up to 24 hours late, or a 0 thereafter.
 Assignment courtesy of Petra Isenberg, Jean-Daniel Fekete, Pierre Dragicevic and Frédéric Vernier under a Creative Commons Attribution-ShareAlike 3.0 License.