Accurate and contrast
invariant junction detection
Gui-Song
Xia
CNRS CEREMADE, Univ. Paris-Dauphine, Paris, France
Julie
Delon, Yann Gousseau
CNRS LTCI, Telecom ParisTech, Paris, France
Abstract: This paper introduces a
generic method for the accurate analysis of junctions, relying on a statistical
modeling of normalized image gradients. We analyze junctions as local visual events
that do not happen by chance under a background model derived from the a-contrario
methodology. The method not only provides thresholds for the detection of
junctions, but also enables their accurate characterization, including a
precise computation of their type, localization, scale and geometrical
configuration. The efficiency of the method is evaluated through various
experiments
Numerical
Results:
1.
Stability and choice of the threshold
|
ACJ |
|
|
|
|
|
Harris |
|
|
|
|
|
Pj on gPb |
|
|
|
|
|
|
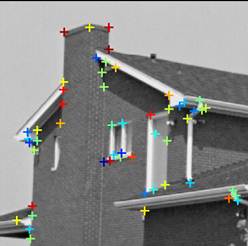
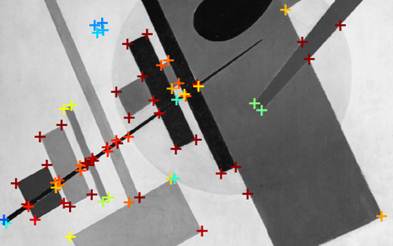
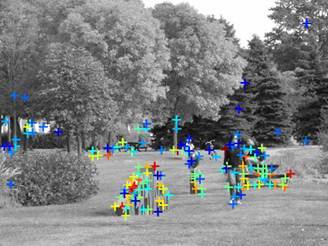
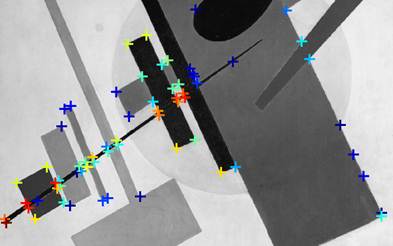
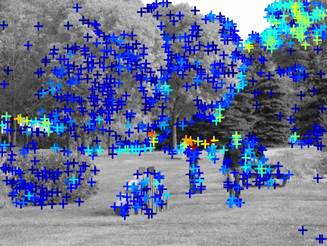
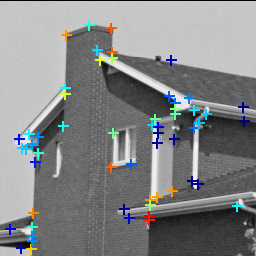
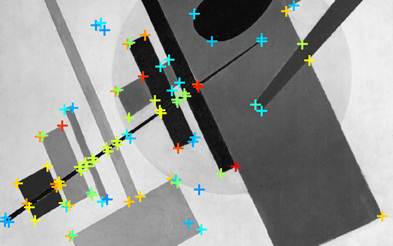
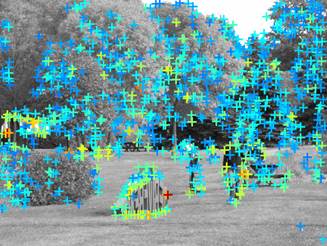
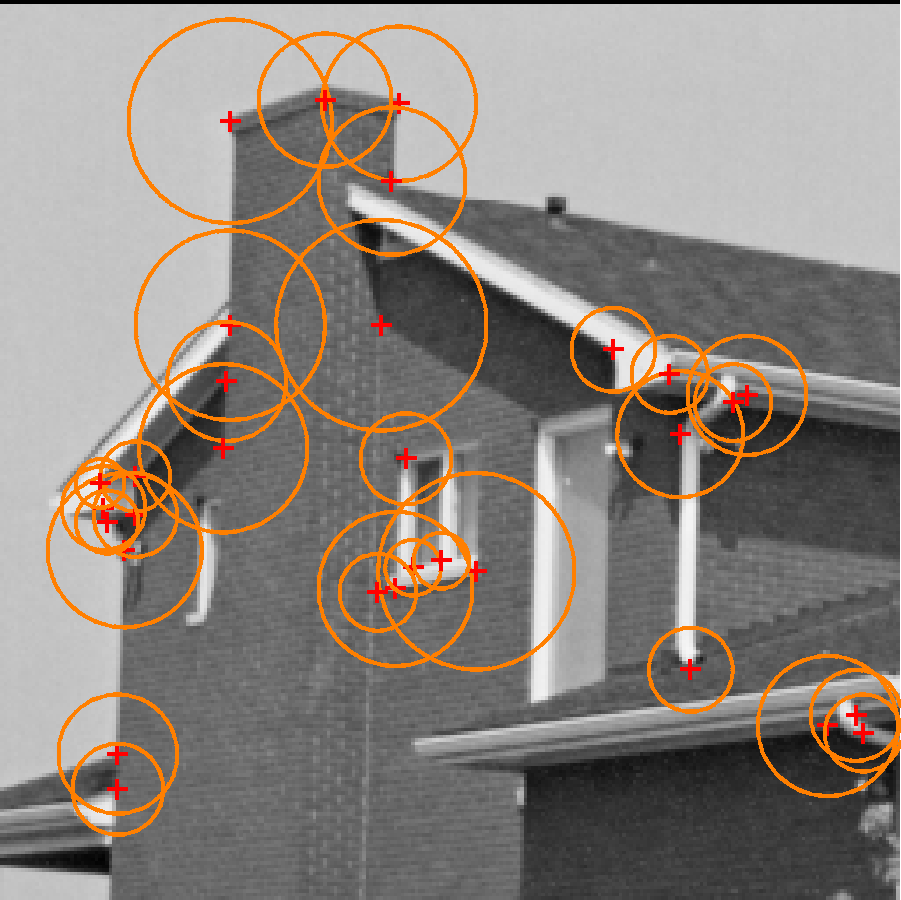
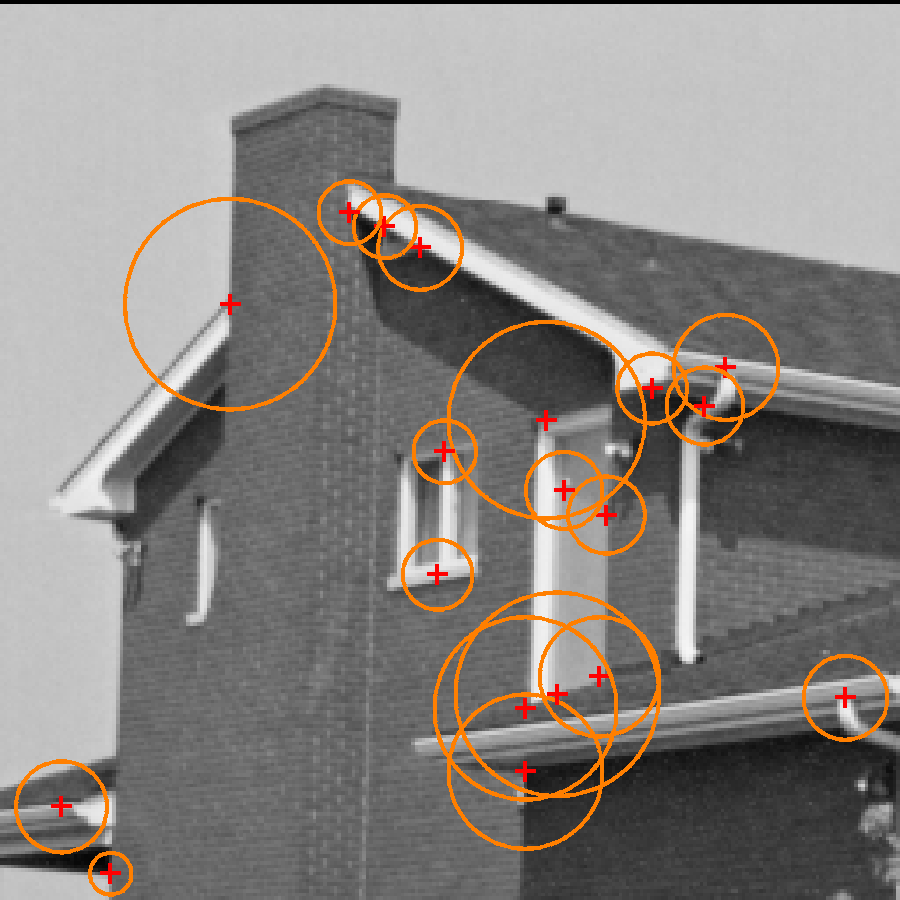
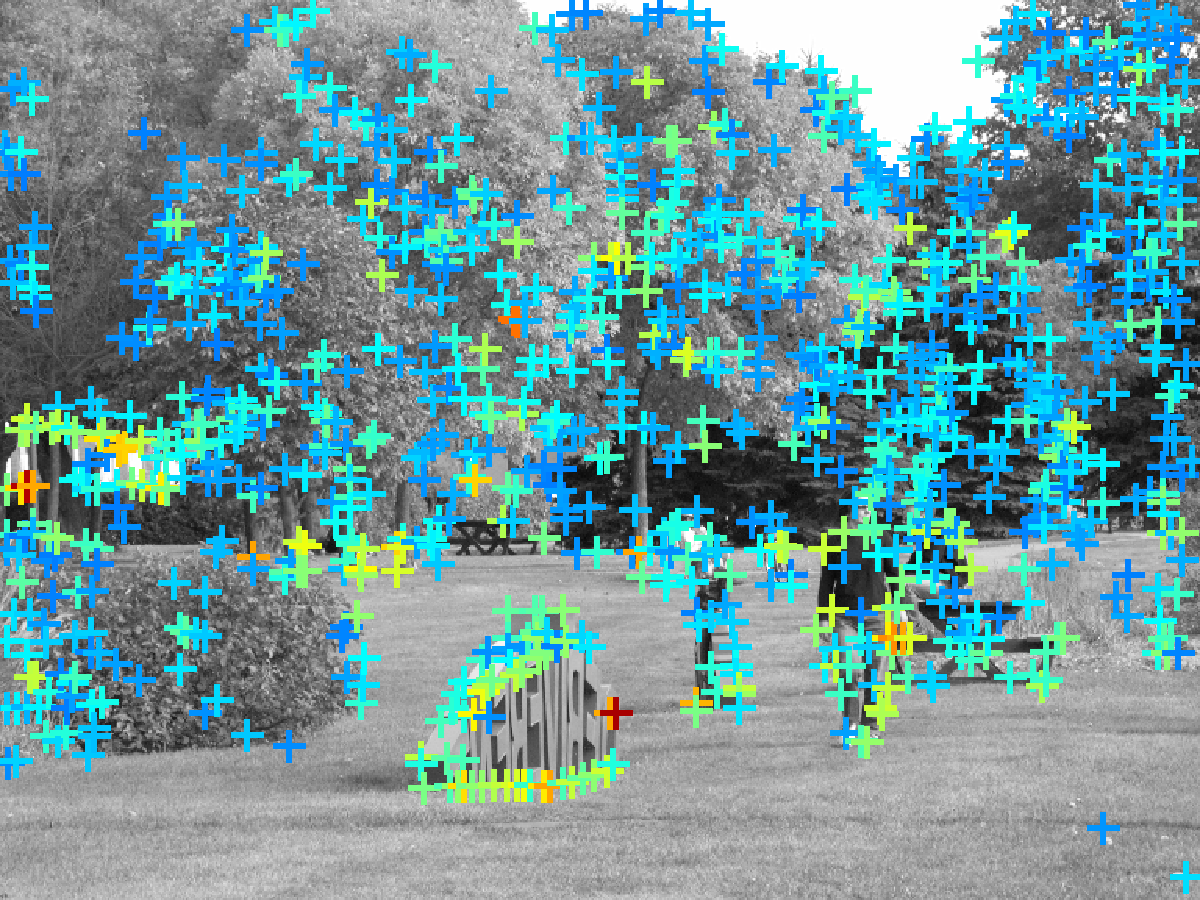
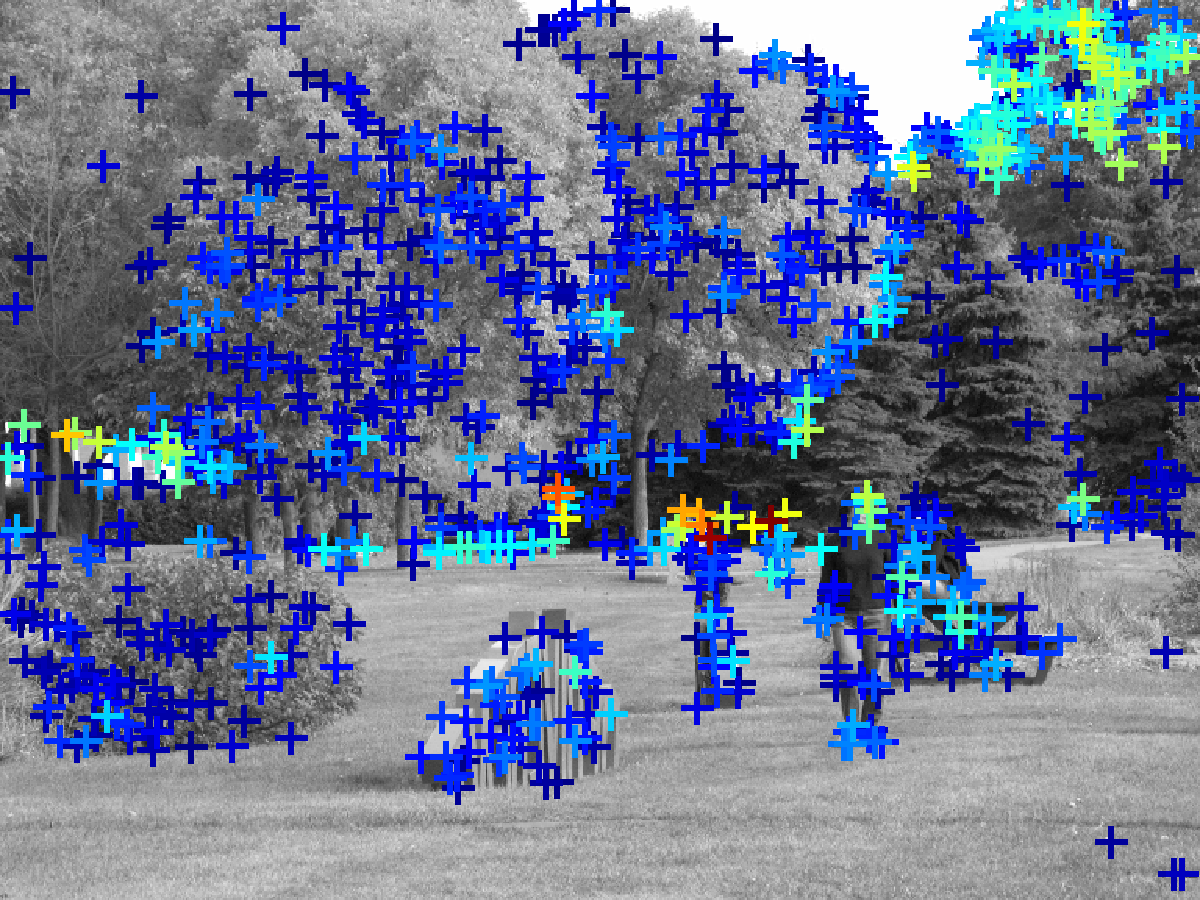
Junctions obtained by ACJ (top
row), Harris (mid row) and “Pj on gPb” (bottom row). The parameters are fixed for the
three images, yielding the same number of detections on the house image (this
correspond to epsilon equals 1). Observe that only ACJ prevent from
over-detection in textured areas. The color of the junction depends on the
NFA value (red corresponds to small values, i.e. very meaningful junctions
and blue corresponds to high values). |
|||
2.
Quantitative evaluation of scale invariance
|
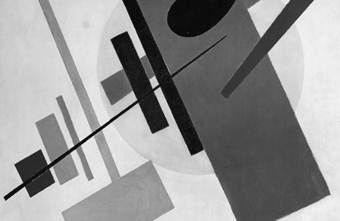
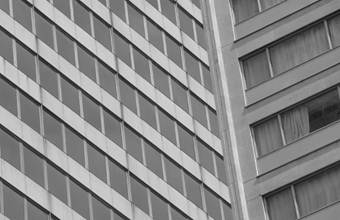
tested images |
|
|
|
|
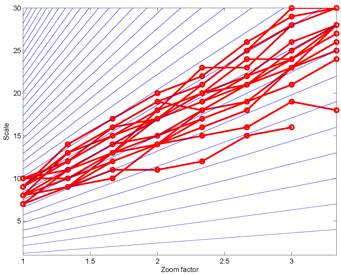
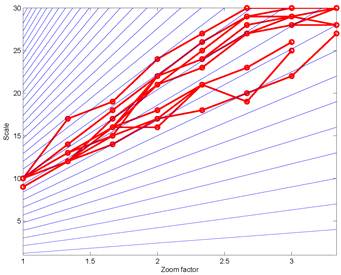
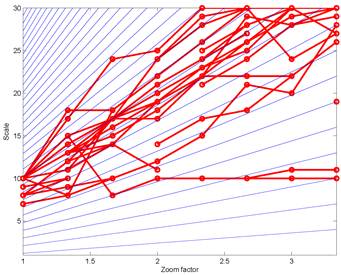
Scales of junctions detected by
ACJ along the scale space |
|
|
|
|
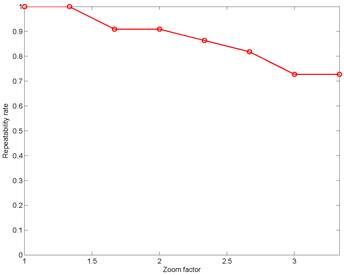
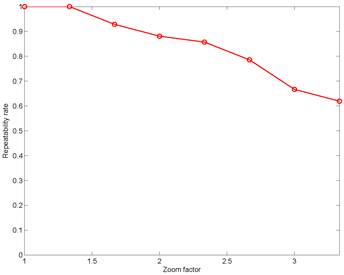
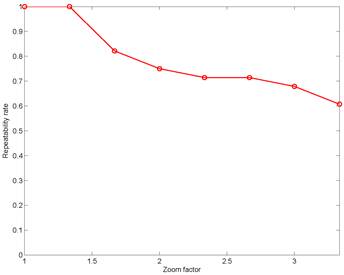
The repeatability rate on the
scale space |
|
|
|
|
|
Illustration of the
scale invariance along the scale space. The first row shows the tested
images. The second row shows the scales of junctions detected by ACJ along
all the trajectories (the list of detected junctions in the scale space [2] , curves in red) as a
function of the zoom factor si (the abscissa is si). The baselines (y = r si), where r changes from 1 to 90,
are displayed in blue. The bottom row presents the repeatability rate of the
junctions as a function of the zoom factor. |
||
|
|
|
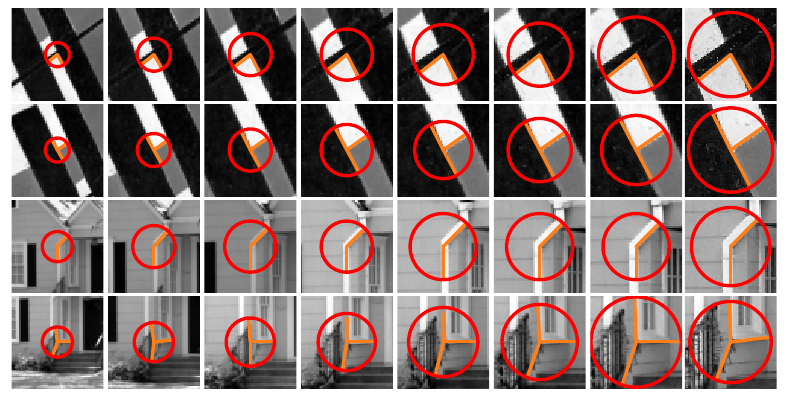
Examples of detected junctions along
several junction trajectories: each row shows a list of junctions detected at
the same relative locations in images, from the coarsest to the finest
resolution. In these examples, junctions can be followed along complete
trajectories, and their scales remain roughly proportional to the image
resolution. |
3.
Quantitative evaluation of contrast invariance
|
|
|
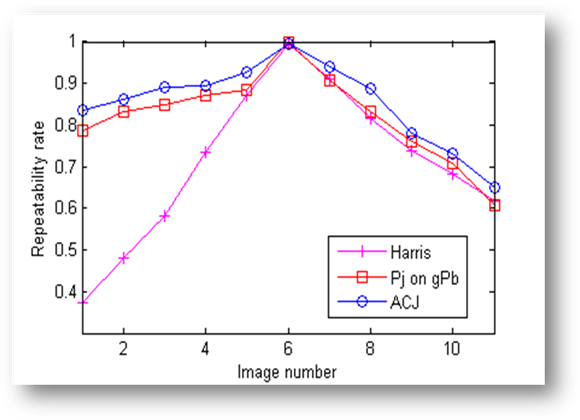
Repeatability rate of different approaches
regarding contrast changes. The curves are averaged over 9 image sequences.
Each sequence is obtained by applying different gamma corrections (as
specified in the text) to a test image. |
4.
More detection results
|
|
|
|||
|
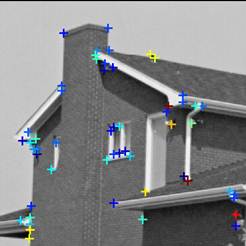
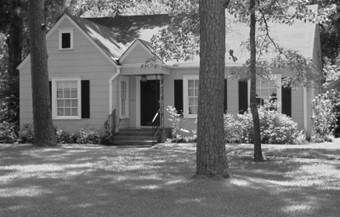
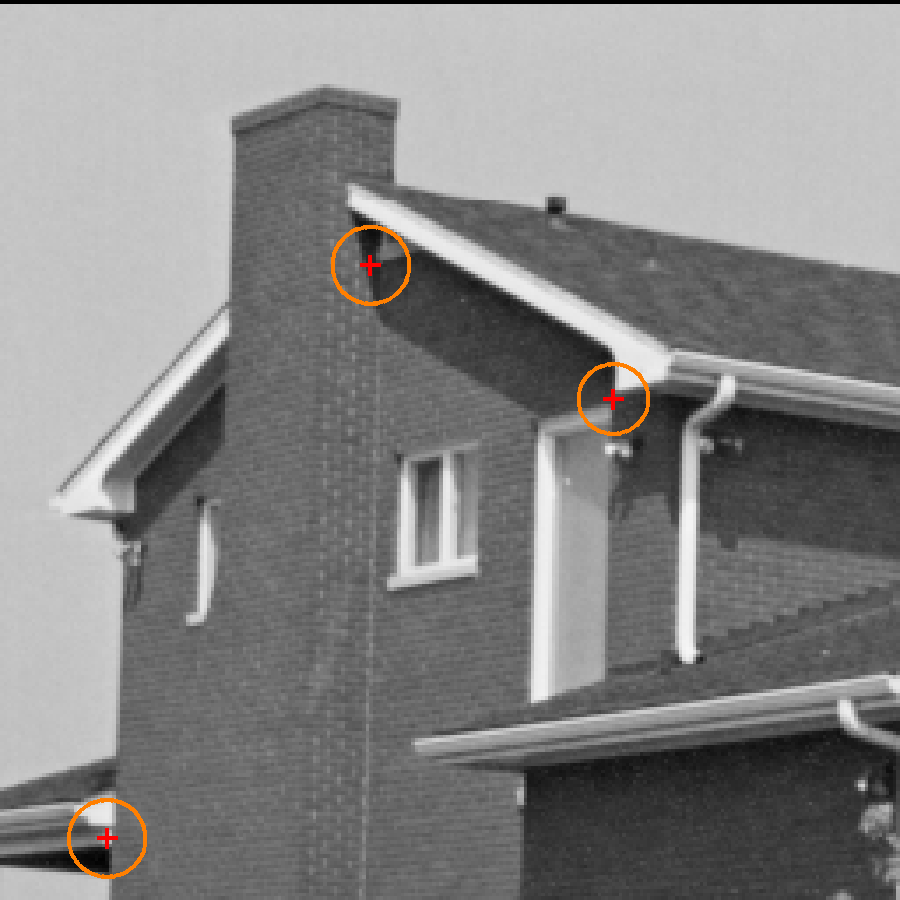
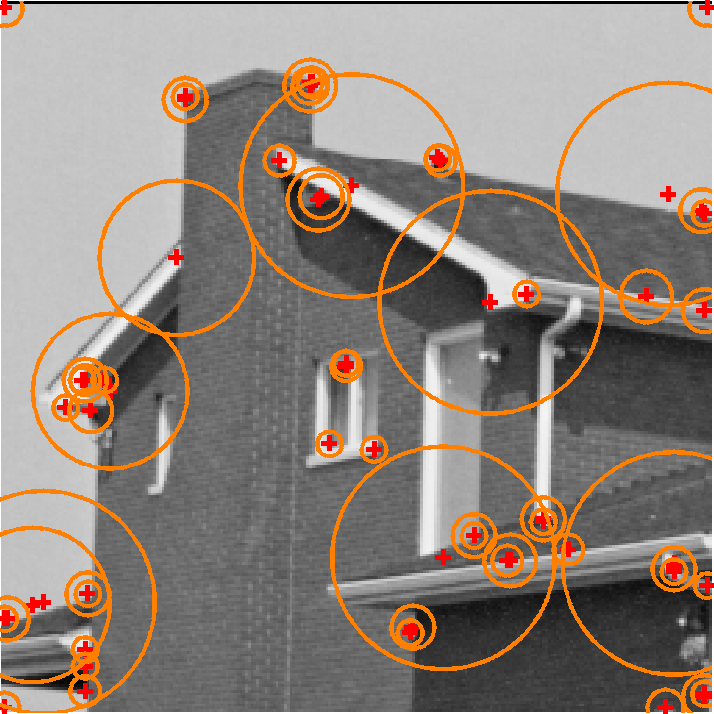
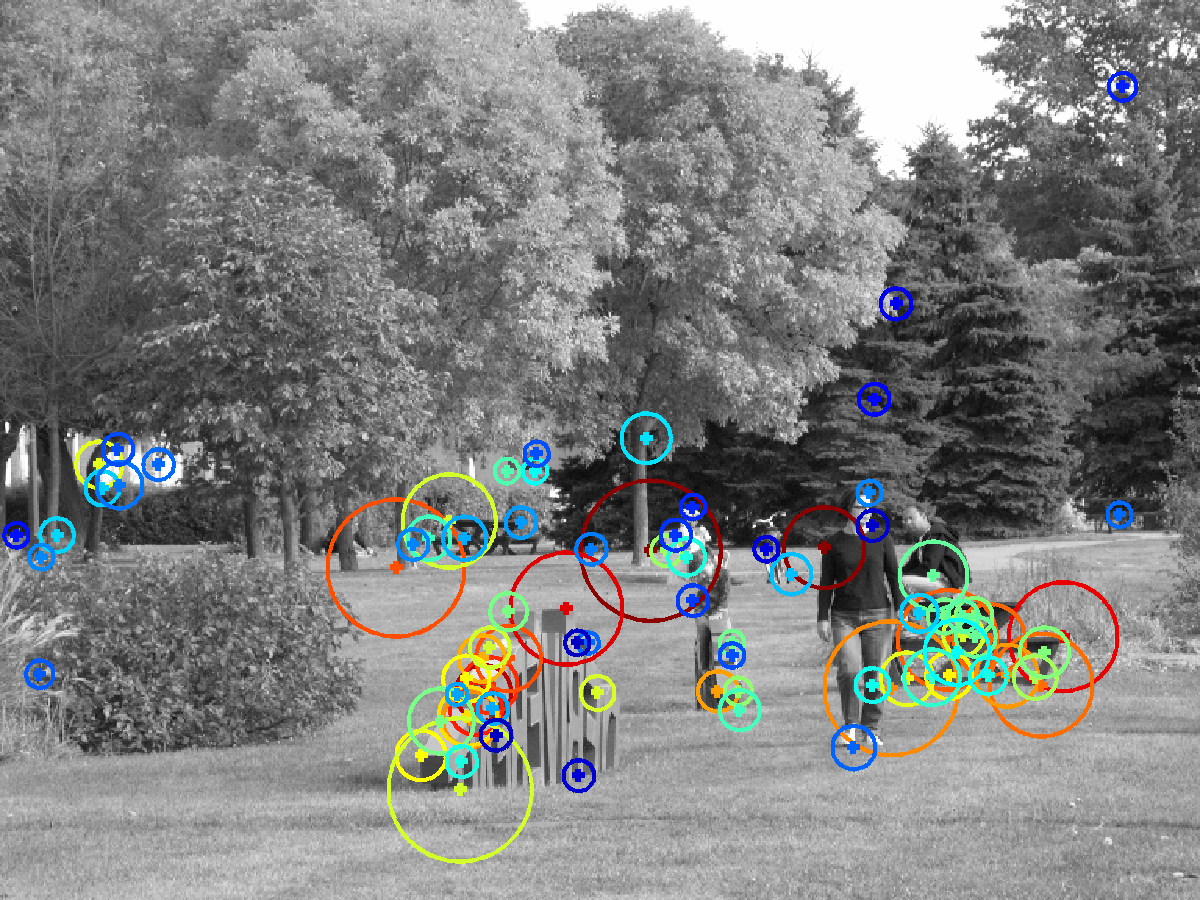
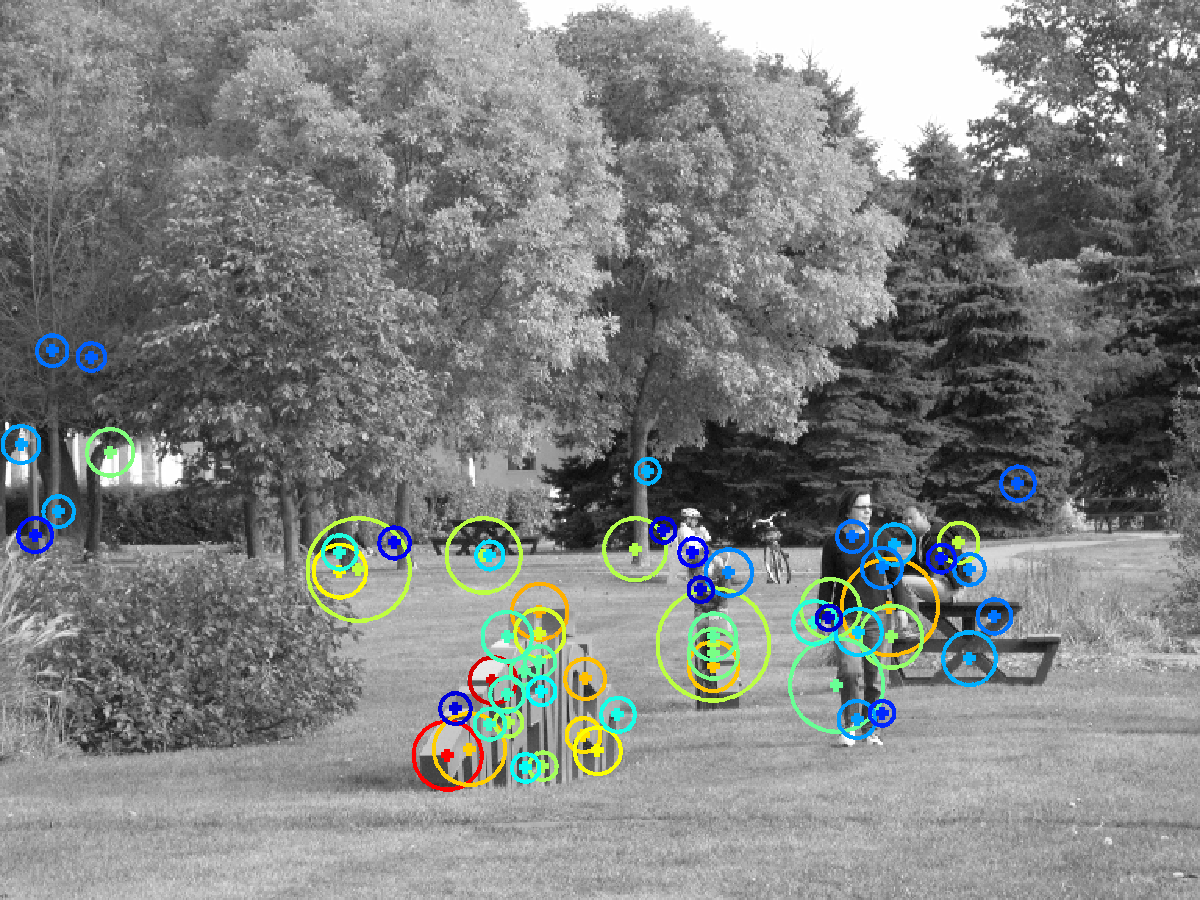
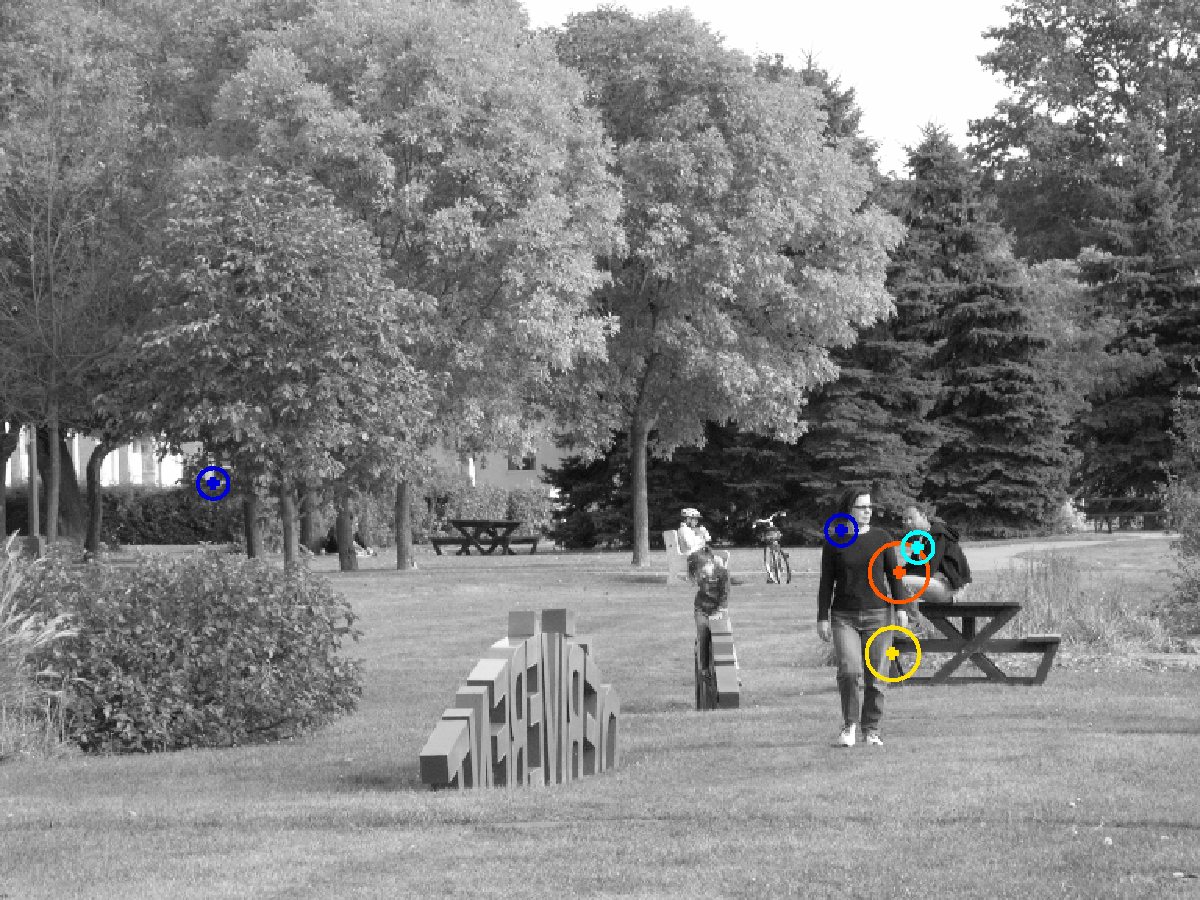
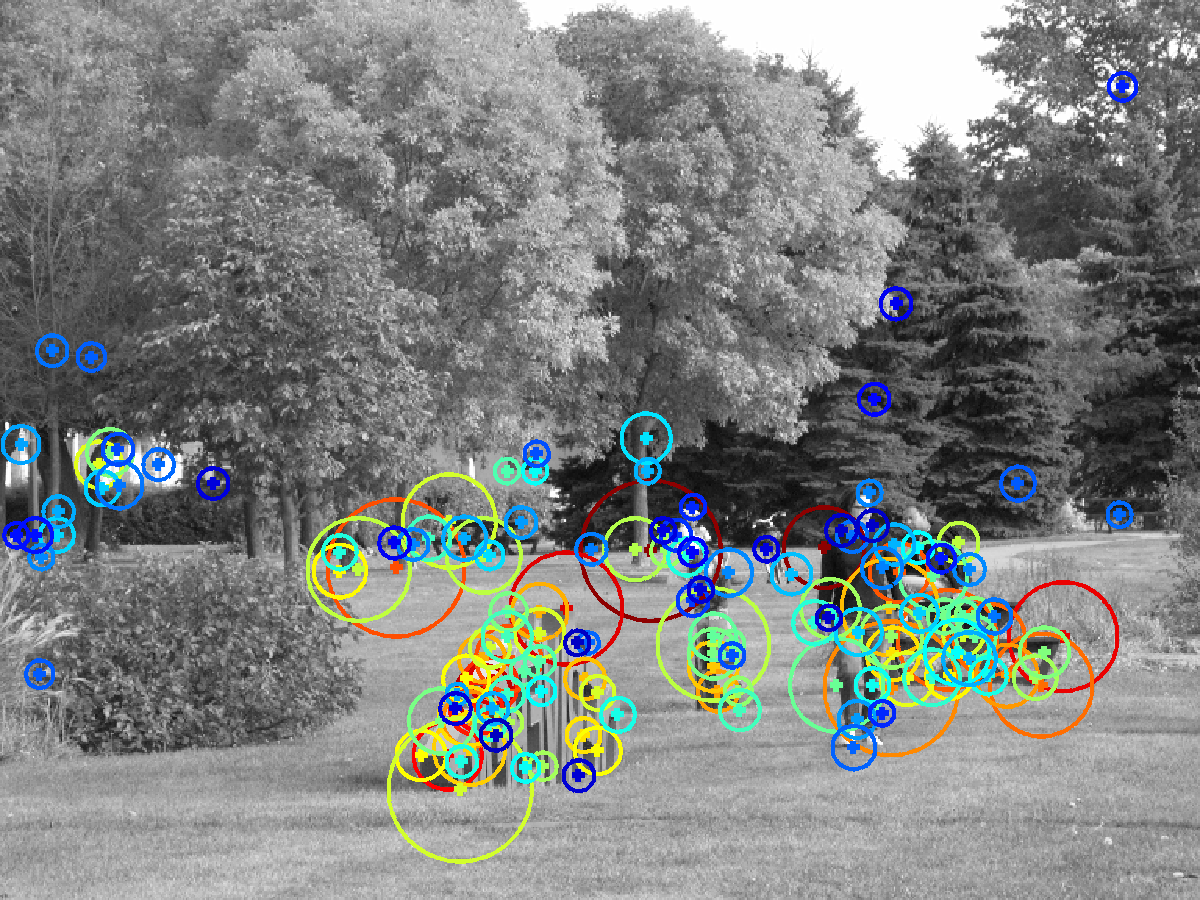
(a) the characterization
of L-, Y- and X-junctions given by the proposed approach; |
(b) result given by
Harris-Laplace |
|||
|
Junction
characterization on the house image. (a) shows the
characteristic scale of L-, Y- and X-junctions given by the proposed approach,
and (b) shows the characteristic scale of junctions given by Harris-Laplace.
The location of each junctions is indicated by a red
cross and circles have a radius equal to the corresponding scale. |
||||
|
||||
References:
- An accurate and
contrast invariant junction detector. [PDF]
Gui-Song Xia, Julie Delon, Yann Gousseau,
The 21th International Conference on Pattern Recognition (ICPR): Tsukuba, Japan, 2012. - Accurate junction detection and
characterization in natural images, (Technical Report). [PDF]
Gui-Song Xia, Julie Delon, Yann Gousseau,
Technical Report HAL-00631609